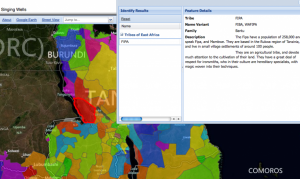
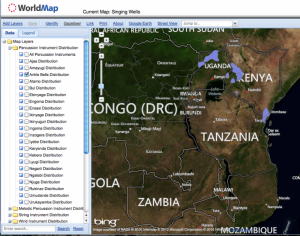
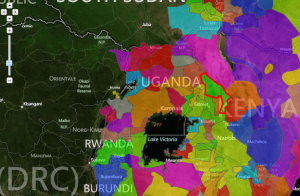
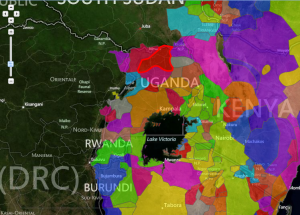
To help us gain as much insight into the role of music in the areas we visit, we want to know as much as possible about the tribal and musical structure of East Africa. Over the last few months The Abubilla Music Foundation worked with Tati Kalveks and Rosie Balfour-Lynn to do this research. It was directed using WorldMap, an interesting way of visually displaying data. Here is a shot of the map below, the highlighted regions are the areas in which layers of information have been embedded. When accessing the map, this is what your screen would look like.
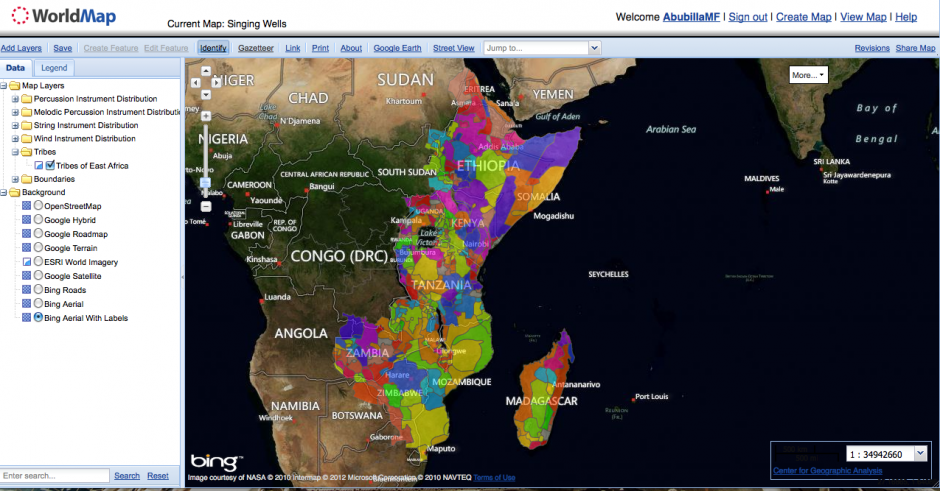 The map, which you can access here, is a result of a platform developed by Harvard University. WorldMap is a great platform for a project like this for several reasons. It is free and open source which means any researcher can work with the source code to extend and improve its functionality, so it is constantly developing and improving. It’s also web-based so it’s easy to access and share, which is exactly what we want in order to carry on building the Singing Wells community.
Rosie has made some ‘how-to’ guides on how to add to a map yourself which you can access easily on our website too, in a few steps, ‘Housekeeping’, ‘The Map Outline’, ‘Prepare Your Data’.
I met with Rosie to talk about her experience using the map for the benefit of Singing Wells.
How did you discover the mapping software?
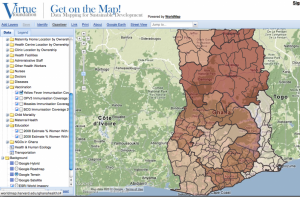
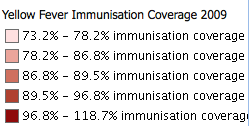
I am currently reading medicine at UCL, but during my gap year I spend time doing work experience in preparation. I was introduced to this new way of displaying data when working for the Virtue Foundation in 2011. They were keen on this new technique and trained me to use it for mapping health data in Ghana (example shown below). This was in collaboration with Harvard University. Following on that I spent some time working with the GIS department at Harvard in Boston specifically learning how to use the mapping software, and I also attended GIS classes given at Harvard. I then brought the idea to Singing Wells when I began work in the summer of 2012.
 Why do you think it is the best way to display data?
When displaying data it’s no secret that people often understand it better when it’s interesting visually; this is why we often use charts and diagrams rather than bodies of text nowadays. Most people’s brains aren’t able to see patterns in data easily, especially when the data set is huge, so representing it in this manner means you can understand it easily. Looking at a map of where an instrument is used makes a lot more sense than looking at a table of regions and what instruments are used there. As we’ve put the data on a map where you can choose which layers of information you’d like to see, the map is useful for a huge variety of different topical questions, unlike one single chart. It also makes it more accessible to someone coming to this field of study for the first time – they don’t need to know where all of the tribes in East Africa are to understand the general distribution of musical styles or instruments, anyone can relate to a map of the world.
How did you make Worldmap work for Singing Wells?
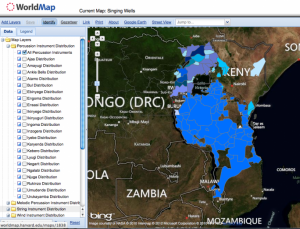
As Worldmap is open source we were able to use a map of the distribution of tribes in Africa created by a Harvard professor named Suzanne Blier. By using her research we could create a map of only the tribal borders of East Africa, from a layer she had created. Once we had a map that only represented these tribal groups we then attached further information on each tribe to this layer so there would be extra information about each group, anyone can access this by clicking on any area (each tribe is separated by colour – this is shown in the image of the map above). We then used this tribe distribution map as the basis for all other layers, for example, using data we had collected about instrument distribution to link it to the map. This means one can compare tribal structures with musical styles. This could go on, such as with information about dress, language, history of conflict, customs etc. Below is an example of how the layers on the map can be used..
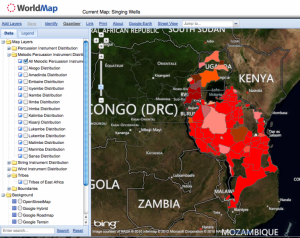
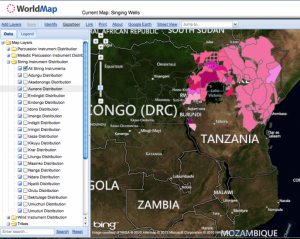
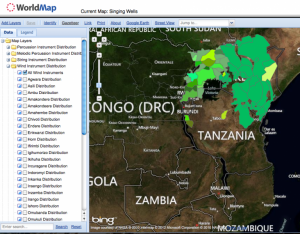
The map above gives an indication of where ankle bells are generally used in East Africa: broadly in Uganda and in specific parts of Kenya. Interestingly, the distribution of broad musical styles are distinctively different. While one would assume that Kenyan music is dominated by percussion, it is clear from the maps (above and below) that actually string and wind instruments are most prominent, and, largely, string and wind instruments are played together:
What was most difficult about this field of research?
Tati handled most of the primary research, and, naturally, this was difficult as information on the subject is fairly scarce and sometimes contradictory. However, the beauty of the map (as with search engines and online encyclopedias such as Wikipedia), it is Open Source and so people from all around the world can add information to make the map a very useful source of information. By creating the basics, as we have, the broad tribal and musical structure of East Africa is there, now we can only add to it! There was also the difficulty of classification. There are hundreds of different language groups and dialects between tribes in East Africa, meaning that within the huge range of instruments there were also a number of different names for them. This became very interesting to discover however, and over time that information could gather on the map, making it more comprehensive.
What did you find most interesting about the data you collected?
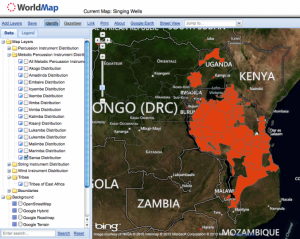
What stood out for me was the huge range of instruments used, and the huge range of percussion instruments available, which you don’t really see in Western music. There were also particular instruments that were surprisingly common that I would not have associated with African music, such as the Sansa, a type of thumb piano:
Writing a profile for all of the different tribal groups was also fascinating. There are such a wide variety of different customs and beliefs in one area, and some tribes, such as the Pokot tribe from Kenya, were memorable for some of their cultural theories. Interestingly, while the home is central to their culture, women’s position in society is weak, and are considered to be ‘foolish’, like the cows for which they are traded upon marriage. Polygamy is widely practiced, and so long as a man has enough wealth in terms of cows to offer, marrying more than one wife is common. This seems contradictory as women are of primary importance in running a home. Deep in the roots of cultural tradition is the practice of female circumcision. It is regarded as part of a woman’s rite of passage before marriage, and functions as a method of preventing a married woman from committing adultery. 1% of Ugandan women undergo the procedure, compared to 95% of Pokot girls. Times are changing, however. Since the Female Genital Mutiliation or ‘FGM’ Act in 2009 the practice has been on decline, but this year in particular Pokot men have come to women’s aid by rejecting the practice. There were reports in February of this year of men demonstrating with large placards against FGM. One man, Mr Lotolim, a resident of Jumbe village in Amudat District, reported that Pokot men often only resort to polygamy because their first wives have difficulty giving birth due to the dangerous procedure, so to have children men need multiple wives (allAfrica.com).
I also found the Acholi tribe hugely interesting. The map provides basic information about the tribe and displays where they settled (left). We have now added to this to make a profile for the Acholi and other tribes we will come across during our field visit to Northern Uganda this month. As result of the tragic war in Northern Uganda, where the civilians faced terror from Joseph Kony’s Lord Resistance Army, the Acholi are emphasizing even more the importance of musical, dance and festival tradition, in an attempt to rediscover their cultural glory. Now 90% of the Acholi tribe have been moved to displacement camps. Their cultural heritage has become even more important now as their homeland has been taken away. This is particularly prevalent in the documentary ‘War Dance’, which I recommend to any interested.
WorldMap has benefitted Singing Wells greatly even leading us to create our own Music Map which archives our own raw data from our field trips. You can access this on the ‘Discover the Music’ part of the website.

